Emily and Marian’s Introduction to Programming for Scientists Project
This is question number thirteen of our Term Project and we would like to display our favoured plot.
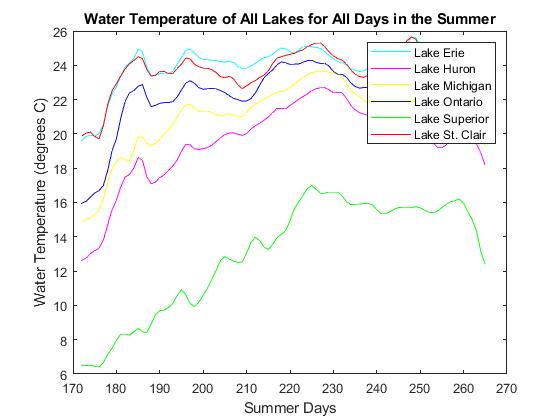
This is the graph we have chosen to display on our web page. It is the favoured plot because of its aesthetic qualities, consisting of a wide variety of vibrant colours. The data is organized and very easy to read and understand what is trying to be communicated with the use of this plot. We have also chosen this graph because it displays the temperature for the lakes during the summer. This is valuable information because we like going to the beach and do not have many opportunities to do so.
